Bacterial growth is an increase in the cell in cell mass and cell number.
Bacterial Growth Curve:
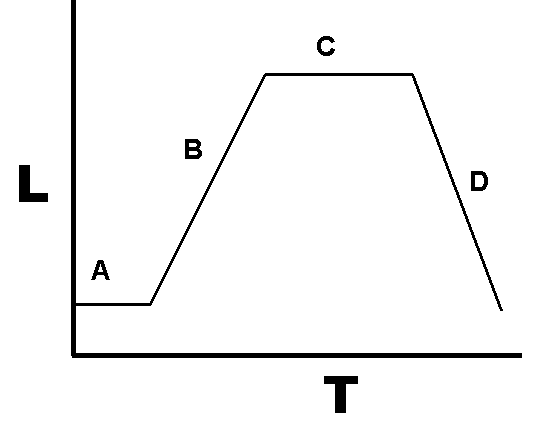
under favorable conditions bacterial population doubles at regular intervals. When a fresh medium is inoculated with cells and the bacterial population growth is monitored over some time, plotting data between growth and time leads to a typical bacterial growth curve.
PHASE of Growth

LAG phase:
immediately after inoculation of cells into fresh medium. In this phase, cells are adapting their surrounding environment. The bacterial population remains the same (temporarily unchanged). There is no cell division. During lag phase cells aren’t at the dormant stage. In the graph, we can see the lag phase as ‘A’. Duration of this phase may vary within bacterial species; environmental conditions, culture and it can last from 1 hour to days.
LOG phase:
sometimes this phase is also known as the exponential phase because in this phase cell growth is exponential. A cell doubles in number. Cell growth depends upon the environmental conditions and culture medium. Cell growth is at a maximum rate, using most of the nutrient medium. In the above graph, we can see the LOG phase as ‘B’.
The growth rate in the LOG phase is 20, 21, 22, 23… 2n (n is the number of generations)
The STATIONARY phase of bacterial growth:
due to lack of essential nutrients and change in environmental factors of the provided medium cell growth became almost stopped. Bacteria start producing toxins (metabolic wastes) it affects the growth of other cells. In the stationary phase numbers of viable cells are equals to the number of dead cells. In the graph ‘C’ represents the stationary phase.
DEATH phase or DECLINE phase:
the reverse of log-phase if incubation continuous after the bacterial population reaches the stationary phase, growth is followed by the death phase. represented as ‘D’ in the graph. Death phase occurs due to:
- Lack of nutrients
- Cells start producing toxins
Generation time: Time required for cell for divide.
Bacterial growth rate formula:
Generation time = t/n
Where t is time in minutes
And n is number of generations
Factors affecting the growth of cell
- Temperature
- Acidity
- Nutrients
- Oxygen
- Endo/Exotoxins produced by cell
********************************************** KEY points *********************************************************
- Lag phase: no cell growth, cell adapt to the provided environment
- Log phase: maximum cell growth, maximum consumption of nutrients, the cell grows exponentially, rate of cell growth 2n
- Stationary phase: lack of nutrients, cell growth became stable, number of viable cells = number of dead cells
- Dead phase: due to lack of nutrients cells starts dying.
************************************************* References ********************************************************
- 1. Zwietering, M. H., Jongenburger, I., Rombouts, F. M., & Van’t Riet, K. J. A. E. M. (1990). Modeling of the bacterial growth curve. Applied and environmental microbiology, 56(6), 1875-1881.
- 2. Baranyi, J., & Roberts, T. A. (1994). A dynamic approach to predicting bacterial growth in food. International journal of food microbiology, 23(3-4), 277-294.
- 3. Baranyi, J., McClure, P. J., Sutherland, J. P., & Roberts, T. A. (1993). Modeling bacterial growth responses. Journal of Industrial Microbiology, 12(3-5), 190-194.
895241 227909Thank you for this amazing post! It has long been really valuable. I wish which you will carry on posting your expertise with us. 370746